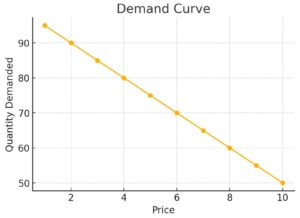
The demand curve is a graphical representation of the relationship between the price of a good and the quantity demanded by consumers over a specific period. It illustrates how demand changes as prices fluctuate, playing a critical role in economic analysis, pricing strategies, and market equilibrium. By plotting prices on the vertical axis and quantities demanded on the horizontal axis, the demand curve typically slopes downward, indicating that as prices decrease, the quantity demanded increases. This relationship helps businesses and policymakers understand consumer behavior, optimize pricing strategies, and achieve market equilibrium by balancing supply and demand.
1. What Is the Demand Curve?
The demand curve shows the quantity of a good that consumers are willing and able to purchase at different prices. It is typically downward-sloping, reflecting the inverse relationship between price and quantity demanded, as described by the law of demand.

A. Key Features of the Demand Curve
- Inverse Relationship: Higher prices lead to lower demand, and lower prices lead to higher demand.
- Axes Representation: Price is plotted on the vertical axis (Y-axis), and quantity demanded is plotted on the horizontal axis (X-axis).
- Downward Slope: Reflects the law of demand in a graphical format.
2. Law of Demand and the Demand Curve
A. Law of Demand
- Principle: As the price of a good decreases, the quantity demanded increases, and vice versa, assuming all other factors remain constant (ceteris paribus).
B. Graphical Representation
- Demand Curve: A downward-sloping line from left to right, showing the price-quantity relationship.
3. Determinants of the Demand Curve
A. Price of the Good
- Determinant: Changes in price result in movement along the demand curve.
B. Consumer Income
- Determinant: Higher income shifts the demand curve to the right for normal goods and to the left for inferior goods.
C. Prices of Related Goods
- Substitutes: An increase in the price of one good increases demand for its substitute.
- Complements: An increase in the price of one good decreases demand for its complement.
D. Consumer Preferences
- Determinant: Changes in tastes and preferences shift the demand curve.
E. Population
- Determinant: A larger population increases demand, shifting the curve to the right.
F. Expectations
- Determinant: Future expectations of price increases can increase current demand.
4. Shifts in the Demand Curve
A. Rightward Shift
- Cause: Increase in income, favorable changes in preferences, or decrease in the price of complements.
- Impact: Higher quantity demanded at each price level.
B. Leftward Shift
- Cause: Decrease in income, unfavorable changes in preferences, or increase in the price of complements.
- Impact: Lower quantity demanded at each price level.
5. Movement Along the Demand Curve
A. Expansion
- Movement: Downward along the curve due to a decrease in price.
B. Contraction
- Movement: Upward along the curve due to an increase in price.
6. Types of Demand Curves
A. Linear Demand Curve
- Type: A straight line showing a constant rate of change in demand with price changes.
B. Non-Linear Demand Curve
- Type: A curved line showing varying rates of change in demand with price changes.
7. Elasticity of the Demand Curve
A. Elastic Demand
- Definition: Demand changes significantly with small price changes.
B. Inelastic Demand
- Definition: Demand changes minimally with price changes.
C. Unitary Elastic Demand
- Definition: Proportional change in demand to a change in price.
8. Importance of the Demand Curve in Economics
A. Price Determination
- Importance: Helps in setting prices by analyzing demand levels at different price points.
B. Business Decisions
- Importance: Guides businesses in production planning, inventory management, and pricing strategies.
C. Market Analysis
- Importance: Assists in understanding consumer behavior and market demand.
D. Policy Formulation
- Importance: Helps governments in making decisions regarding taxation, subsidies, and price controls.
9. Challenges in Analyzing the Demand Curve
A. Data Limitations
- Challenge: Inaccurate data can distort the demand curve analysis.
B. Dynamic Market Conditions
- Challenge: Frequent changes in market conditions make demand curve analysis complex.
C. Consumer Behavior
- Challenge: Unpredictable consumer preferences add to demand volatility.
10. The Role of the Demand Curve in Market Economics
The demand curve is a vital tool in economic analysis, illustrating the relationship between price and quantity demanded. It aids businesses, economists, and policymakers in making informed decisions related to pricing, production, and market interventions, ensuring efficient resource allocation and market stability.