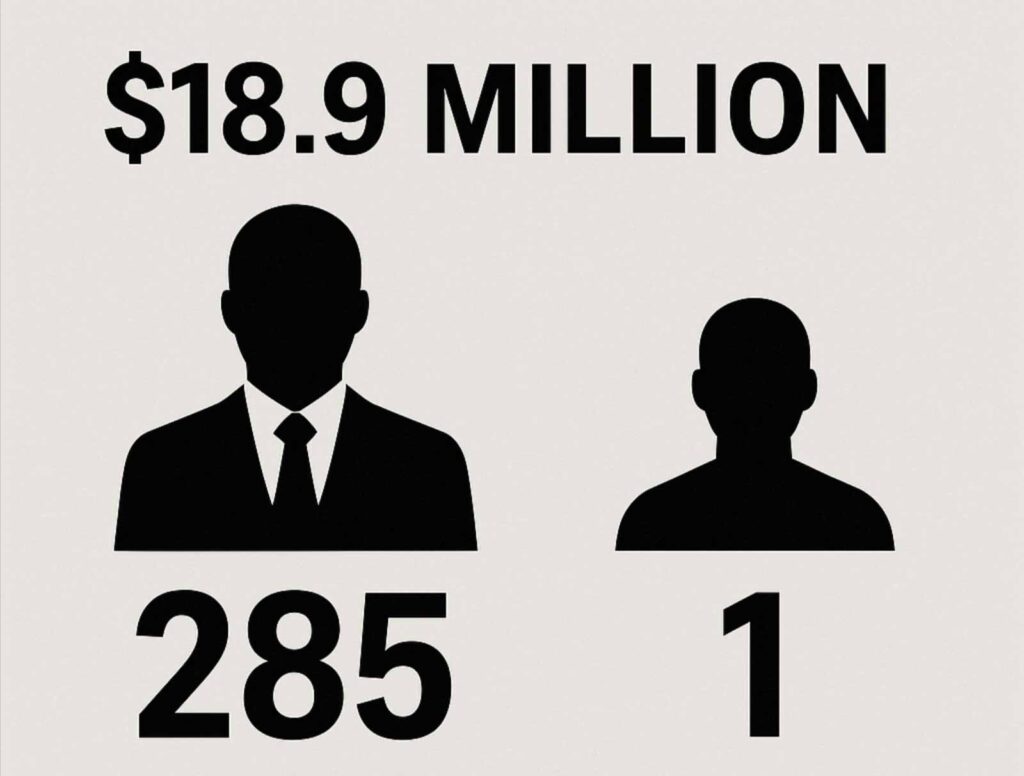
In the United States today, corporate CEOs earn hundreds of times more than their workers. In 2024, the average chief executive of an S&P 500 company took home about $18.9 million in total compensation – roughly 285 times the pay of a typical employee. For context, in 1965 top CEOs made only 21 times as much as the average worker. This stark metric, known as the CEO-to-worker pay ratio, has surged over the decades and become a flashpoint in debates about economic fairness. Is this widening gap a meaningful indicator of U.S. economic inequality? Many economists, policymakers, and workers believe it is – while others caution that the figure can oversimplify a complex reality. This article examines what the CEO-to-worker pay ratio represents, how it has evolved from the 1970s to today, and what it reveals (and doesn’t reveal) about broader inequality in America.
What Is the CEO-to-Worker Pay Ratio?
At its core, the CEO-to-worker pay ratio is a simple comparison: it measures how many times more a chief executive officer earns compared to an average (or median) worker. Calculation is straightforward in concept: take the total annual compensation of a CEO and divide it by the annual pay of a typical worker. For example, if a CEO makes $10 million a year and the company’s median employee earns $50,000, the CEO-to-worker pay ratio would be 200-to-1. In practice, however, defining “CEO pay” and “worker pay” isn’t trivial. Major studies (such as those by the Economic Policy Institute) focus on total realized CEO compensation – including salary, bonuses, stock awards and stock options – at the nation’s largest public companies. The “typical worker” is often represented by the average annual wages (plus benefits) of a full-time rank-and-file worker in the same industries. This approximates what a normal employee earns, allowing a direct comparison to the chief executive’s paycheck.
It’s worth noting that since 2018 U.S. public companies have been required by the Securities and Exchange Commission to disclose their CEO-to-median employee pay ratio in annual proxy statements. This rule, born out of concern over rising executive pay, has made the statistic more visible to the public. Each company’s ratio can vary widely – a global retail giant with many low-wage workers may report a far higher ratio than a tech firm with highly paid engineers. But across the corporate landscape, the general pattern is clear: CEO pay packages dwarf typical worker earnings, and the gap has grown dramatically.
A Growing Gap: Then and Now
The disparity between CEO compensation and worker pay in the U.S. has skyrocketed over the past half-century. In the late 1970s, the ratio was on the order of just 30-to-1. To put that in perspective, a CEO might have earned in a week what an average employee earned in several months. By the 1980s the gap was widening – 60-to-1 by 1989 according to economic data. Then came an explosion in the 1990s: stock market booms and lavish executive stock options sent CEO pay into the stratosphere. By 2000, at the peak of the dot-com bubble, the CEO-to-worker pay ratio hit roughly 300- to 400-to-1. In other words, a CEO of a major firm could earn over 300 times what a typical worker made.
That trend has largely persisted into the 21st century. The tech bust and financial crisis saw temporary dips in executive pay, but the long-term trajectory remains upward. After the 2008 recession, CEO compensation rebounded along with the stock market. Over 2009–2022, another surge in CEO pay brought the ratio back up to about 344-to-1 by 2022. Even with some fluctuations year to year, the pay gap has stayed far above historical levels. In 2023, amid a slight market cooldown, CEOs of the largest firms were still making around 290 times the pay of a typical worker. Contrast this with earlier eras: in 1965, as mentioned, the ratio was only 21-to-1, and throughout the 1950s–1970s it was under 30-to-1. The last two decades have consistently seen ratios in the 200–300+ range, levels unprecedented in the post-war period. Clearly, something changed in how the rewards of corporate success are shared – or not shared – between those at the top and everyone else.
To put these numbers in dollar terms, consider typical paychecks. The Bureau of Labor Statistics reports that the median annual wage for all U.S. workers was about $49,500 in 2024. Meanwhile, average CEO compensation at S&P 500 companies (a group of the largest firms) was roughly $18–19 million that year. That jaw-dropping difference illustrates the ratio in real life: it would take the median worker several lifetimes of work to earn what a top CEO makes in a single year. The AFL-CIO union federation poignantly noted that a median employee would have to start working in the year 1740 to accumulate the 2024 pay of the average S&P 500 CEO. Such comparisons, while dramatic, underscore just how large the gulf has become.
What the Pay Ratio Reveals About Inequality
The rise of the CEO-to-worker pay ratio has mirrored, and arguably contributed to, broader economic inequality in America. Since the late 1970s, the U.S. has experienced what economists call the “Great Divergence” – a sharp increase in the concentration of income at the top, after a period of relative equality in the mid-20th century. Top executives’ outsized pay is one facet of this trend. In fact, analysts identify surging executive compensation relative to average workers as one driver of widening income gaps. As CEOs and other top earners pulled in dramatically higher rewards, the gains for rank-and-file workers largely stagnated. From 1978 to 2023, CEO compensation (adjusted for inflation) jumped by over 1,000%, while a typical worker’s pay increased only about 24% in the same period. Put differently, four decades of economic growth yielded little pay raise for the average worker, but a jackpot for those in the corner office. This imbalance is a key dynamic in the overall growth of inequality.
Wider data on U.S. incomes bear this out. The share of national income earned by the top 1% of households roughly doubled from the late 1970s to the mid-2000s – rising from about 9% in 1979 to over 20% by 2007. Even after taxes and transfers, which even out some differences, inequality remains markedly higher than it was 40–50 years ago. By the 2010s, the United States had a Gini coefficient (a measure of income inequality) at multi-decade highs (around 0.48–0.49 in recent Census Bureau estimates, versus ~0.39 in 1970). Middle-class incomes grew much more slowly than upper-tier incomes, and lower-income wages barely budged in real terms. In this context, the CEO-to-worker pay ratio serves as a telling statistic. It encapsulates in one number the story of many economic forces – the weakening bargaining power of workers, the skyrocketing of stock-based wealth, and the emergence of a “winner-take-all” economy. As the Economic Policy Institute points out, exorbitant CEO pay is not just a symbolic symptom of inequality but a contributor: it concentrates earnings at the top, effectively leaving “fewer gains for ordinary workers” and pulling up pay even among other high earners. In other words, when those at the top take an ever-larger slice of the pie, less is left for everyone else – exacerbating the gap between rich and poor.
Perspectives on the Pay Gap: Symbol of Fairness or Oversimplified Metric?
Not everyone interprets the CEO-to-worker pay ratio the same way. Labor advocates and critics of corporate excess argue that the soaring ratio is a clear symbol of systemic inequality – a sign that something is broken in how companies reward work. Organizations like the AFL-CIO have long highlighted these numbers to draw attention to what they call “runaway” executive pay. In fact, the AFL-CIO’s annual Executive Paywatch report explicitly frames rising CEO pay as “fueling economic inequality” in the country. From this perspective, such an extreme gap between the boss and the workers is inherently unfair and socially corrosive. It’s seen as evidence that CEOs are extracting outsized rewards not commensurate with their contribution, made possible by weak corporate governance and bargaining power imbalances. Supporters of this view often note that CEOs do not work 200 or 300 times harder than their employees – rather, they have greater leverage to set their own pay. “CEOs do not work 281 times harder than the typical worker – they just have the power to set their own pay,” as EPI’s chief economist put it pointedly. Advocates see the ratio as a moral and economic indictment of the status quo, arguing that such concentration of wealth at the top hurts employee morale, widens the rich-poor gap, and even dampens consumer demand (since ordinary workers have less spending power). It has prompted calls for reform: higher taxes on excessive executive pay, stronger unions to boost workers’ wages, and policies (like pay ratio disclosure or surtaxes) to incentivize narrower pay gaps.
On the other side of the debate, critics contend that the CEO-to-worker pay ratio can be a misleading or oversimplified measure. Business groups and some economists argue that focusing on this single number doesn’t account for important nuances. For one, the ratios publicized in headlines often apply mainly to the largest, most profitable corporations – the elite CEOs of the S&P 500 or top 350 firms. There are over 300,000 chief executives in the U.S. (including small business owners, nonprofit directors, public sector chiefs, etc.), and most of them earn nowhere near tens of millions. If one includes a broader sample of companies beyond the top tier, the average CEO pay falls and the ratio to typical workers shrinks considerably. A Canadian study, for example, found that the very top 100 CEOs skewed the pay gap statistics – when they looked at the next 100 CEOs, the average pay ratio dropped from nearly 190:1 to about 77:1, and broader averages fell to under 50:1. The lesson, critics say, is that the worst cases drive the narrative, and they might not reflect the reality for the majority of firms.
Moreover, skeptics of the ratio argue that high CEO pay in some instances may reflect the marketplace for skills or the scale of a large enterprise, rather than simple greed. A CEO running a multinational corporation with hundreds of thousands of employees worldwide will naturally oversee far more revenue and complexity than a CEO of a local company – and, defenders claim, their pay often reflects that scale. Some academic voices have suggested that pay gaps per se are not always harmful to company performance; in fact, one study found firms with larger CEO-to-employee pay gaps sometimes had better shareholder returns, positing that high pay can be a reward for delivering growth. And while the U.S. ratio is extreme, outsized earnings at the top are a broader phenomenon not confined to CEOs. Superstar actors, musicians, and athletes today command eight- or nine-figure incomes, far above the average worker, thanks to global markets and technology expanding their reach. As researchers at the Fraser Institute noted, “top performers in entertainment and sports receive compensation equivalent to, or higher than, most CEOs” – a reflection of an economy where the best in any field reap very large rewards. From this viewpoint, the growth of CEO pay is a symptom of larger economic forces (globalization, technological change, the “winner-take-all” dynamics in many industries) rather than a simple tale of corporate boards gone wild.
Finally, there’s the argument that fixating on the ratio could lead to unintended consequences. If companies feel pressure to lower the metric without addressing underlying issues, they might do things like outsourcing low-paid jobs (thus removing them from the payroll and instantly boosting the median wage used in the ratio). This could make a company’s figures look fairer without actually raising any worker’s pay – essentially gaming the system. Or a firm might shy away from hiring certain categories of workers to keep the median pay high. These scenarios illustrate that the ratio alone doesn’t tell the whole story of workplace fairness or how a company treats its employees.
The Bottom Line: An Indicator Hard to Ignore
Despite these debates, the CEO-to-worker pay ratio remains a powerful yardstick for gauging economic disparity. Its value isn’t in pinpoint precision or nuance, but in the big picture it paints. And that picture is unmistakable: over the last few decades, the rewards of economic growth in the United States have become heavily skewed toward the top. The fact that a CEO today can earn 300 times the pay of an ordinary employee – when it used to be 20 or 30 times – is a shorthand for the widening chasm in wealth and income. It highlights how much more top executives and shareholders are taking home relative to the typical worker on Main Street. Indeed, public opinion tends to side with the concern that the gap is too wide. Polls regularly show that Americans feel CEOs are overpaid; one recent survey found 73% believe CEOs of large companies are paid excessively (versus only 13% who think they’re paid “about right”). This sentiment suggests that, whatever the academic arguments, many see the huge pay ratios as a sign of inherent unfairness in the economy.
In the end, the CEO-to-worker pay ratio is best viewed as an indicator of broader trends – a kind of shorthand for the state of income distribution. It does not capture every nuance of economic inequality, but it encapsulates something real and important: the growing distance between those at the pinnacle of corporate America and the typical workers whose labor underpins those corporations. As former Labor Secretary Robert Reich quipped, “The ratio of CEO pay to worker pay is a symptom of the same disease as the widening gap between the rich and everyone else.” The dramatic rise of this ratio over time has both reflected and reinforced the U.S. march toward greater inequality.
Whether one believes this ratio is an outrage or an oversimplification, it has undeniably sparked a conversation. From the halls of Congress to boardrooms to dinner tables, people are asking what it means for a society when the boss makes in one day what a worker makes in a year (or often much more). That question goes beyond just numbers – it strikes at perceptions of fairness, the value of work, and the social contract between employers and employees. In that sense, the CEO-to-worker pay gap serves as a vivid symbol of economic imbalance. And symbols, as we know, can be powerful catalysts: driving debate, shaping policies, and perhaps even nudging the pendulum toward a more equitable future.