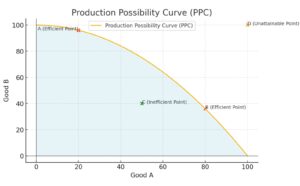
The Production Possibility Curve (PPC), also known as the Production Possibility Frontier (PPF), is a graphical representation that shows the maximum possible output combinations of two goods or services an economy can produce, given its resources and technology. This curve is a valuable tool in economics, as it illustrates several key concepts that are fundamental to understanding economic theory.
Firstly, the PPC highlights the concept of scarcity. Because resources are limited, an economy cannot produce unlimited quantities of both goods. The curve demonstrates the trade-offs that must be made when allocating resources between different products. If an economy is operating on the curve, it means that resources are being used efficiently, and the production of one good can only increase if the production of another good decreases.
Secondly, the PPC emphasizes the concept of choice. Economies must decide on the best combination of goods and services to produce based on their resources and societal needs. This decision-making process involves evaluating the benefits and costs of different production options and choosing the combination that maximizes overall welfare.
Finally, the PPC illustrates the concept of opportunity cost. Opportunity cost is the value of the next best alternative that is foregone when a choice is made. On the PPC, this is represented by the slope of the curve. Moving from one point to another on the curve shows the opportunity cost of increasing the production of one good in terms of the amount of the other good that must be sacrificed.
In summary, the Production Possibility Curve (PPC) is a fundamental economic model that demonstrates the principles of scarcity, choice, and opportunity cost. It provides a clear and intuitive way to understand how economies allocate their limited resources to produce different combinations of goods and services.
1. What Is the Production Possibility Curve?
The PPC illustrates the trade-offs between two goods when resources are limited. It demonstrates the maximum output an economy can achieve if all resources are fully and efficiently utilized.

A. Key Features of the PPC
- Scarcity: Resources are limited, so producing more of one good means producing less of another.
- Opportunity Cost: The cost of forgoing the next best alternative when making a choice.
- Efficiency: Any point on the curve represents efficient utilization of resources.
- Trade-offs: Movement along the curve shows the trade-off between two goods.
B. Importance of the PPC
- Resource Allocation: Helps in deciding how to allocate limited resources efficiently.
- Economic Growth: Demonstrates the potential for growth when resources or technology improve.
- Policy Decisions: Assists governments in making decisions about production priorities.
2. Assumptions of the Production Possibility Curve
A. Fixed Resources
- Assumption: The quantity of resources (land, labor, capital) remains constant.
B. Constant Technology
- Assumption: The level of technology used in production remains unchanged.
C. Full Employment
- Assumption: All resources are used efficiently with no unemployment or underutilization.
D. Two Goods
- Assumption: The economy produces only two types of goods for simplicity.
3. Shape of the Production Possibility Curve
A. Concave to the Origin
- Reason: Increasing opportunity costs as resources are not perfectly adaptable between goods.
- Example: Moving resources from agriculture to manufacturing may become less efficient as specialized resources are diverted.
B. Straight Line PPC
- Reason: Constant opportunity costs when resources are equally efficient in producing both goods.
4. Key Concepts Illustrated by the PPC
A. Opportunity Cost
- Definition: The value of the next best alternative forgone.
- Illustration: Moving from one point on the PPC to another shows the opportunity cost of increasing production of one good.
B. Efficiency and Inefficiency
- Efficiency: Points on the PPC represent efficient use of resources.
- Inefficiency: Points inside the PPC indicate underutilization of resources.
C. Economic Growth
- Outward Shift: Indicates an increase in resources, better technology, or economic growth.
- Inward Shift: Represents a decline in resources or economic contraction.
D. Unemployment
- Illustration: Points within the curve show unemployment or underemployment of resources.
5. Applications of the Production Possibility Curve
A. Resource Allocation
- Application: Helps in deciding how to allocate resources between different sectors like agriculture and industry.
B. Economic Policy
- Application: Assists policymakers in prioritizing production based on societal needs.
C. Economic Growth Analysis
- Application: Evaluates the impact of technological advancements and resource changes on production capacity.
D. Trade-Off Analysis
- Application: Shows the trade-offs involved in shifting resources between different types of goods.
6. Limitations of the Production Possibility Curve
A. Simplistic Assumptions
- Limitation: Assumes only two goods and constant resources, which is unrealistic in complex economies.
B. Static Model
- Limitation: Does not account for dynamic changes like technological advancements and population growth.
C. Ignoring External Factors
- Limitation: External factors like trade, government policies, and global markets are not considered.
7. The Significance of the Production Possibility Curve
The Production Possibility Curve is a vital tool in economics, illustrating key concepts like scarcity, opportunity cost, efficiency, and economic growth. While it simplifies complex economic realities, it provides valuable insights into resource allocation, trade-offs, and production capabilities, making it essential for economic analysis and policymaking.