The supply curve is a graphical representation of the relationship between the price of a good or service and the quantity supplied by producers over a specific period. It illustrates how supply changes with price fluctuations, serving as a critical tool for economic analysis, pricing strategies, and market equilibrium. By plotting prices on the vertical axis and quantities supplied on the horizontal axis, the supply curve typically slopes upward, indicating that as prices increase, producers are more willing to supply a greater quantity of the good. Understanding the supply curve helps businesses and policymakers analyze market behavior, set optimal prices, and ensure a balanced supply-demand relationship.
1. What Is the Supply Curve?
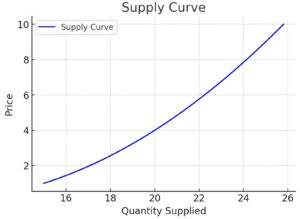
The supply curve shows the quantity of a good that producers are willing and able to supply at different price levels. It typically slopes upward, reflecting the direct relationship between price and quantity supplied.
A. Key Features of the Supply Curve
- Upward Slope: Higher prices lead to higher quantities supplied.
- Axes Representation: Price on the vertical axis (Y-axis) and quantity supplied on the horizontal axis (X-axis).
- Market Dynamics: Reflects producers’ responses to price changes.
2. Law of Supply and the Supply Curve
A. Law of Supply
- Principle: As the price of a good rises, the quantity supplied increases; as the price falls, the quantity supplied decreases, assuming other factors remain constant (ceteris paribus).
B. Graphical Representation
- Supply Curve: An upward-sloping line from left to right, showing the price-quantity relationship.
3. Determinants of the Supply Curve
A. Price of the Good
- Determinant: Higher prices incentivize producers to supply more.
B. Production Costs
- Determinant: Lower costs increase supply; higher costs reduce supply.
C. Technology
- Determinant: Advances in technology improve efficiency, shifting the supply curve rightward.
D. Government Policies
- Determinant: Taxes reduce supply, while subsidies increase it.
E. Prices of Related Goods
- Substitutes: Higher prices of alternative goods may reduce supply of the current good.
- Complements: Jointly produced goods may increase supply together.
F. Expectations of Future Prices
- Determinant: Anticipation of higher future prices may reduce current supply.
G. Number of Suppliers
- Determinant: More suppliers increase overall market supply.
4. Shifts in the Supply Curve
A. Rightward Shift
- Cause: Technological improvements, lower input costs, subsidies.
- Impact: Higher quantity supplied at each price level.
B. Leftward Shift
- Cause: Higher input costs, new taxes, supply chain disruptions.
- Impact: Lower quantity supplied at each price level.
5. Movement Along the Supply Curve
A. Expansion
- Movement: Upward along the curve due to a price increase.
B. Contraction
- Movement: Downward along the curve due to a price decrease.
6. Types of Supply Curves
A. Linear Supply Curve
- Type: A straight line showing a constant rate of change in supply with price changes.
B. Non-Linear Supply Curve
- Type: A curved line showing varying rates of change in supply with price changes.
7. Elasticity of the Supply Curve
A. Elastic Supply
- Definition: Quantity supplied changes significantly with small price changes.
B. Inelastic Supply
- Definition: Quantity supplied changes minimally with price changes.
C. Unitary Elastic Supply
- Definition: Proportional change in supply to a change in price.
8. Importance of the Supply Curve in Economics
A. Price Determination
- Importance: Helps in setting market prices through supply-demand interactions.
B. Business Decisions
- Importance: Assists businesses in production planning and pricing.
C. Market Analysis
- Importance: Provides insights into producer behavior and supply levels.
D. Policy Formulation
- Importance: Aids in designing economic policies like subsidies and taxes.
9. Challenges in Analyzing the Supply Curve
A. Data Accuracy
- Challenge: Reliable data on supply is essential but often difficult to obtain.
B. Market Volatility
- Challenge: Rapid market changes affect supply analysis.
C. External Shocks
- Challenge: Events like natural disasters and pandemics disrupt supply.
10. The Role of the Supply Curve in Market Economics
The supply curve is essential for understanding producer behavior, market equilibrium, and pricing mechanisms. By illustrating the relationship between the price of a good or service and the quantity supplied, the supply curve provides valuable insights into how producers respond to price changes. It guides businesses in making informed decisions about production levels, resource allocation, and pricing strategies.
For policymakers, the supply curve serves as a crucial tool in economic planning and policy formulation. By analyzing the supply curve, policymakers can predict how changes in prices, taxes, or regulations will impact production and supply levels. This knowledge enables them to design effective policies that promote economic growth, stability, and sustainability.
Furthermore, the supply curve ensures efficient market operations by helping maintain a balance between supply and demand. When producers and consumers understand the dynamics of the supply curve, they can adjust their behavior to achieve market equilibrium, where the quantity supplied equals the quantity demanded. This equilibrium is vital for preventing shortages or surpluses and ensuring that resources are allocated optimally.
In summary, the supply curve plays a fundamental role in market economics. It provides a framework for understanding and analyzing producer behavior, market equilibrium, and pricing mechanisms. By guiding businesses, assisting policymakers, and ensuring efficient market operations, the supply curve contributes to the overall stability and efficiency of the economy.