
Before investing in a company, how much do you really know about its financial condition?
Is the company consistently profitable? Is revenue growth translating into cash? Is debt increasing? Are existing shareholders being diluted? What risks has management disclosed? Are insiders buying or selling shares?
These are some of the most important questions investors should investigate before making investment decisions. Fortunately, much of the information needed to answer them is already publicly available through the U.S. Securities and Exchange Commission’s EDGAR filing system.
The challenge is not simply obtaining financial information. It is finding the relevant facts, understanding their meaning, comparing reporting periods, evaluating financial relationships, and identifying matters that deserve closer investigation.
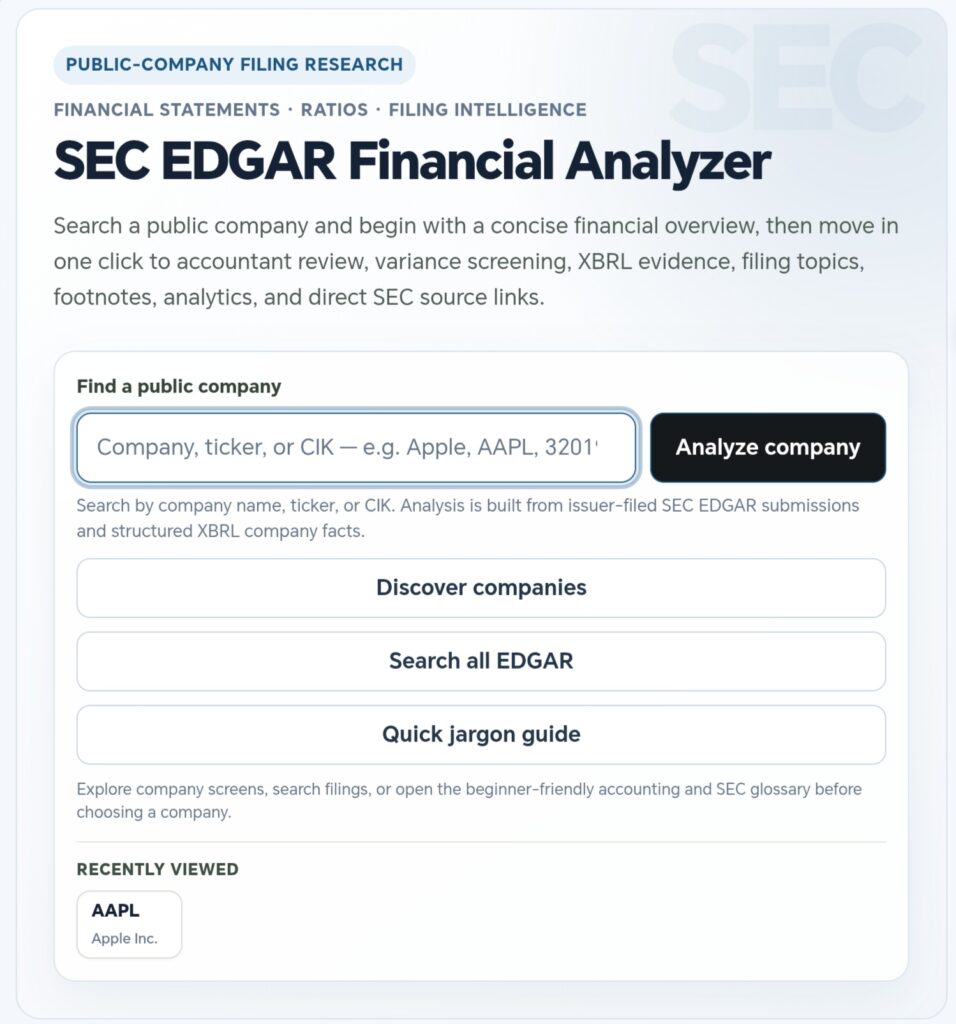
That is why AuditingAccounting.com offers the free SEC EDGAR Financial Analyzer, an online financial research application that organizes company filings, financial statements, accounting ratios, historical trends, ownership information, disclosures, and other research evidence into one comprehensive workspace.
Instead of examining financial figures in isolation, investors can investigate how a company’s financial performance, financial position, cash generation, capital allocation, and disclosures fit together.
Explore the Free SEC EDGAR Financial Analyzer
1. Why SEC EDGAR Is Important for Investors
SEC EDGAR stands for Electronic Data Gathering, Analysis, and Retrieval. It is the filing system used by companies and other reporting entities to submit documents required under U.S. securities laws.
For investors researching U.S. public companies, SEC filings are among the most important primary sources of corporate financial information.
They include much more than headline earnings figures. Depending on the company and filing, investors can examine financial statements, accounting policies, operating results, management commentary, business risks, executive compensation, ownership transactions, acquisitions, debt obligations, and significant corporate developments.
These documents form part of the company’s formal regulatory disclosure record. They are subject to applicable securities-law requirements and can carry significant legal consequences for material misstatements or omissions.
However, investors should not assume every filing is automatically accurate or complete. Errors, amendments, accounting judgments, changing estimates, and subsequent corrections can occur. Reviewing the filing itself remains essential.
Important SEC filings investors should understand
| SEC Filing | Information Available | Why Investors Examine It |
|---|---|---|
| Form 10-K | Annual audited financial statements, business information, risk factors, management discussion, and notes. | Understand the company’s financial condition, profitability, strategy, and principal risks. |
| Form 10-Q | Quarterly financial statements and business updates. | Monitor developments between annual reports. |
| Form 8-K | Specified corporate events and other current disclosures. | Investigate acquisitions, executive changes, earnings announcements, financing events, and other developments. |
| DEF 14A | Proxy information, executive compensation, governance, and shareholder voting matters. | Examine management incentives, board oversight, and governance practices. |
| Form 4 | Reportable transactions and changes in beneficial ownership by certain insiders. | Investigate transactions involving directors, officers, and significant shareholders. |
| Schedule 13D / 13G | Reportable significant beneficial ownership interests. | Research substantial shareholders and ownership changes. |
| Form 13F | Quarterly reports of certain institutional investment holdings. | Research disclosed positions while accounting for reporting delays and coverage limitations. |
| Form S-1 | Registration information commonly associated with initial public offerings. | Study a company’s business, financial history, ownership, and offering risks. |
| Form 20-F | Annual disclosures of many foreign private issuers. | Research foreign companies that report to the SEC. |
Collectively, these filings can help investors investigate a company beyond its stock ticker, share price, or latest earnings headline.
2. The Problem: SEC Filings Contain Vast Amounts of Information
A company’s annual report can contain extensive financial statements, management commentary, accounting disclosures, risk factors, and supporting exhibits.
Important information may be distributed across multiple documents and reporting periods.
For example, an investor researching a company’s debt may need to examine its balance sheet, debt footnotes, contractual obligations, recent financing announcements, and management’s discussion of liquidity.
Another investor researching earnings quality may need to compare net income, operating cash flow, receivables, inventory, stock-based compensation, and accounting policies over several years.
Performing these comparisons manually can be time-consuming, particularly when researching several companies.
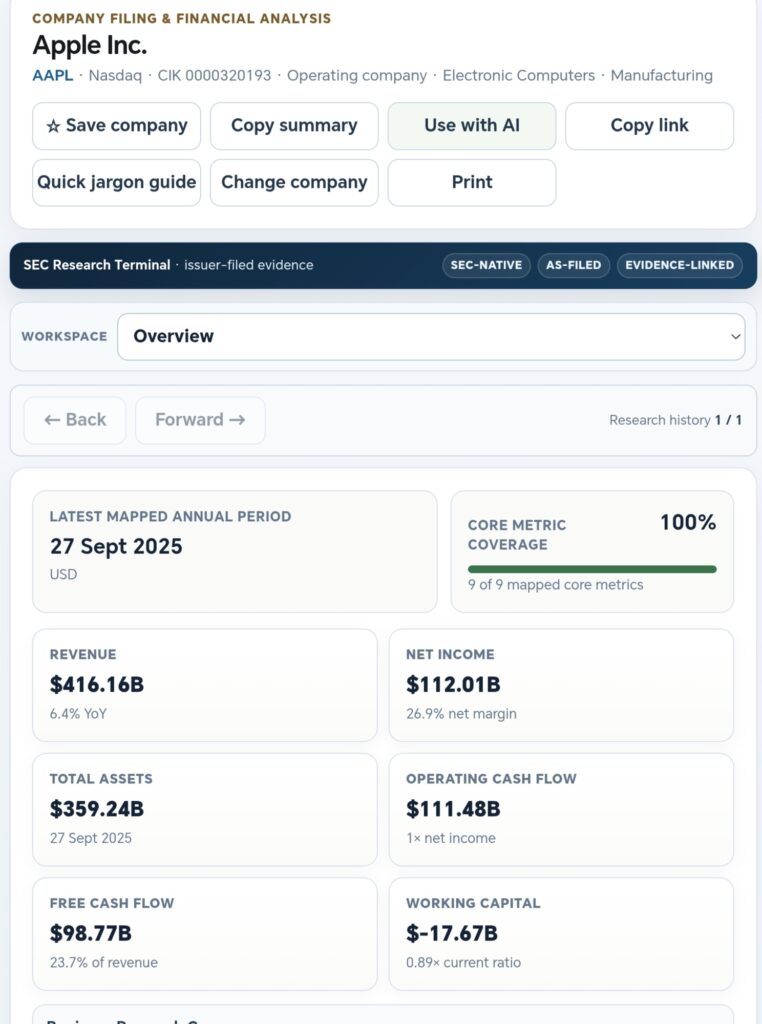
The SEC EDGAR Financial Analyzer helps address this problem by organizing available filing information into practical research workspaces.
It brings together many of the figures, trends, calculations, and supporting documents investors need to examine, while retaining access to the original source evidence.
3. Examine a Company’s Financial Condition in One Place
The SEC EDGAR Financial Analyzer includes an Investor Decision Desk within its Investor Research workspace.
This provides a consolidated view of up to five compatible annual reporting periods, with approximately 35 financial measures organized into six research areas.
Business growth
Examine revenue, operating income, net income, and historical growth patterns.
Investors can ask whether a company’s sales are expanding consistently, whether operating earnings are keeping pace, and whether apparent growth is accompanied by sustained profitability.
Profitability and returns
Study gross margins, operating margins, net profit margins, return on assets, return on equity, and the analyzer’s return-on-invested-capital proxy where sufficient comparable data exists.
These measures can help investors examine how effectively a company converts business activity and invested resources into accounting profits.
Earnings and cash generation
Compare net income with operating cash flow, free cash flow, cash conversion, and accrual-related measures.
A company may report accounting profits without generating equivalent operating cash. Understanding this relationship can be especially important when investigating earnings quality.
Balance-sheet resilience
Review available cash, debt, equity, net debt, liquidity, interest coverage, and leverage measures.
These figures help investors investigate financial obligations and a company’s capacity to manage changing business conditions.
Per-share economics and dilution
Examine diluted earnings per share, diluted weighted-average shares, changes in share count, and share-based compensation relationships.
Growth in company-wide profits does not necessarily produce equivalent growth in earnings attributable to each share.
Capital allocation
Investigate available evidence concerning capital expenditures, acquisitions, dividends, share repurchases, and share issuance.
These activities provide useful context for understanding how management deploys the financial resources of the business.
The Investor Decision Desk also includes data-availability indicators and a due-diligence checklist. It is a research aid, not an investment rating, prediction, or recommendation engine.
4. Analyze Financial Statements Without Manually Calculating Every Ratio
Financial statements become more useful when investors examine the relationships between their components.
The analyzer provides accounting-focused financial statement analysis covering available information from the income statement, balance sheet, and statement of cash flows.
Its financial ratio library includes measures relating to:
- Revenue and earnings growth
- Gross, operating, and net profit margins
- Return on assets and return on equity
- Liquidity and working capital
- Debt and financial leverage
- Asset utilization
- Operating cash flow and free cash flow
- Cash conversion and earnings quality
- Capital expenditure intensity
- Shareholder dilution and per-share performance
Different ratios answer different questions. A high profit margin says something about the relationship between revenue and profit, but it does not by itself establish financial strength, competitive advantage, or an attractive investment valuation.
The analyzer helps investors study these relationships together rather than relying on one isolated number.
Calculations are tied to defined formulas and supporting reporting data. When reliable inputs are unavailable or incompatible, a calculation may be withheld rather than displaying a potentially misleading result.
5. Investigate Whether Reported Profits Are Supported by Cash Flow
One of the most useful questions in fundamental analysis is:
Is the company generating cash from its business, or is reported profitability not being matched by operating cash generation?
Net income and operating cash flow measure different aspects of financial performance.
Net income reflects accrual accounting. Operating cash flow reflects cash movements associated with operating activities, subject to the applicable reporting framework.
Both are important, but they should not be treated as interchangeable.
With the SEC EDGAR Financial Analyzer, investors can examine:
- Net income trends alongside operating cash flow
- Operating cash flow margins
- Available free cash flow measures
- Capital expenditure requirements
- Cash conversion relationships
- Receivables and working-capital movements
- Cash distributions and financing activity
For example, a company might report increasing net income while experiencing weakening cash collection or rising working-capital requirements.
That observation does not automatically establish an accounting problem. It does, however, identify an area worth investigating in the company’s financial statements and notes.
6. Study Financial Trends Using Interactive Charts
A single reporting period rarely tells the complete financial story of a business.
Historical analysis allows investors to investigate whether changes are temporary, persistent, or associated with major corporate developments.
The analyzer provides interactive financial charts covering available trends such as:
- Revenue and profitability
- Operating and net profit margins
- Operating cash flow and free cash flow
- Balance-sheet strength and leverage
- Earnings per share and diluted-share history
- Capital expenditures and capital allocation
- Growth quality and operating intensity
- Common-size financial relationships
- Cash deployment and financing activity
- DuPont-related return analysis
- Filing activity and supporting financial evidence
Chart tooltips allow users to inspect displayed values and periods by hovering, focusing, or tapping supported chart elements.
This helps investors move beyond simply observing that a line rose or fell. They can examine the actual figures behind the visual trend.
Charts use the analyzer’s available accounting data and defined calculations rather than independently inventing estimates.
7. Examine Debt, Liquidity, and Financial Vulnerability
Financial leverage can support business expansion, but excessive or poorly structured obligations may create financial pressure.
Investors should therefore look beyond reported profits and examine how a business finances its operations.
The analyzer brings together available information on:
- Total assets and liabilities
- Cash and cash equivalents
- Borrowings and debt relationships
- Shareholders’ equity
- Current assets and current liabilities
- Working capital
- Liquidity ratios
- Interest coverage
- Debt-to-equity and other leverage measures
Investors can also investigate SEC-filed disclosures concerning defaults, restructuring arrangements, going-concern uncertainties, and bankruptcy-related proceedings where relevant evidence is available.
Importantly, a large loss, high debt balance, going-concern disclosure, or restructuring announcement does not automatically establish that a company is bankrupt.
The analyzer distinguishes filing evidence from unsupported conclusions about a company’s current legal or financial status.
8. Research Insider Transactions, Ownership, and Corporate Governance
Company financial statements tell investors what the business has reported financially. Ownership and governance disclosures provide another important perspective.
The SEC EDGAR Financial Analyzer includes research capabilities relating to ownership filings, executive and director information, shareholder matters, and corporate governance.
Depending on available filings, users can investigate:
- Reported insider transactions
- Open-market purchases and sales
- Officer and director ownership evidence
- Relevant beneficial ownership disclosures
- Leadership and executive-role information
- Leadership-change filings
- Proxy statements and governance records
An insider purchase may be worth investigating, but it is not automatically proof that a stock is undervalued. Similarly, an insider sale may occur for many reasons and does not necessarily indicate deteriorating business prospects.
Transactions should be considered in the context of transaction type, ownership arrangements, filing dates, company fundamentals, and other available disclosures.
9. Examine Dividends, Share Repurchases, and Stock Splits
Corporate actions can affect shareholders even when the underlying business remains largely unchanged.
The analyzer includes research capabilities for available evidence concerning:
- Cash dividends and dividend-per-share history
- Share repurchases
- Share issuance
- Stock splits and reverse splits
- Changes in outstanding shares
- Diluted weighted-average shares
- Tender offers and other supported corporate actions
- Certain spin-off and restructuring events
These records can help investors investigate whether a company is returning capital to shareholders, raising additional equity, or changing its share structure.
A stock split does not, by itself, create additional enterprise value. Likewise, the existence of a share-repurchase authorization does not prove that all authorized shares were repurchased.
The analyzer preserves distinctions between announced, proposed, approved, and completed corporate actions where the filings support them.
10. Investigate Business Segments and Revenue Sources
Consolidated revenue alone may conceal important differences between a company’s business activities.
A diversified company may have some segments experiencing strong growth while others are stagnating or declining.
Where compatible filing data is available, the analyzer can help investors examine:
- Product and service revenue categories
- Geographic revenue distribution
- Business segment information
- Segment assets
- Supported segment profitability information
- Historical changes in business mix
These analyses can provide useful context when investigating business concentration, changing revenue composition, or dependence on particular markets.
Not every reported revenue category represents an independent operating segment. Overlapping financial reporting dimensions are not automatically added together.
11. Read Important Disclosures Beyond the Financial Statements
Financial ratios are useful, but they cannot explain every important risk or business development.
A company may have favorable historical margins while facing litigation, regulatory challenges, material customer concentration, uncertain financing, significant acquisition integration costs, or other developments.
The analyzer’s filing and disclosure research workspaces help users investigate available material from:
- Risk Factors
- Management’s Discussion and Analysis (MD&A)
- Financial statement notes
- Accounting policies and estimates
- Controls and Procedures
- Business descriptions
- Current reports and significant corporate events
- Proxy statements and governance disclosures
- Earnings announcements and filed exhibits
Investors can also explore changes in disclosure wording across selected historical filings.
Such changes can identify topics for investigation. However, a change in wording should not automatically be interpreted as a material deterioration, a new legal problem, or an accounting-policy change.
12. Explore Earnings Releases, Non-GAAP Measures, and Management Guidance
Companies sometimes supplement their financial results with adjusted performance measures and forward-looking commentary.
Examples include adjusted EBITDA, adjusted earnings per share, free cash flow, operating metrics, and management guidance.
These disclosures can be useful, but investors should understand how company-defined measures differ from accounting measures reported under GAAP or IFRS.
Where available in supported SEC-filed earnings exhibits, the analyzer can identify:
- Reported non-GAAP measure terminology
- Reconciliation evidence
- Adjusted EBITDA and adjusted EPS references
- Management guidance and outlook statements
- Explicit guidance ranges
- Statements describing guidance as raised, lowered, maintained, or initiated
- Company-defined operating and performance indicators
The analyzer distinguishes a company’s reported or defined measures from its own clearly labeled accounting proxies.
It does not create analyst consensus estimates, earnings surprises, or price targets that cannot be established from the supported filing evidence.
13. Discover and Compare Companies
Many investors begin with a particular company, while others begin by searching for businesses that meet specific financial characteristics.
The SEC EDGAR Financial Analyzer supports both approaches.
Its Company Discovery workspace provides screens based on available filing-derived financial measures, including:
- Revenue and profit
- Operating cash flow and free cash flow
- Profitability and margins
- Financial leverage
- Revenue growth and decline
- Improving or deteriorating margins
- Profit turnarounds
- Cash generation consistency
- Share dilution
- Capital intensity
- Selected combinations of growth and cash-flow characteristics
The application also includes industry exploration and a peer-comparison workbench.
Investors can examine selected companies using comparable accounting measures, with contextual statistics such as medians, quartiles, and historical trends where the underlying evidence allows.
Peer statistics describe the selected comparison group. They should not be interpreted as universal industry benchmarks or investment-quality scores.
14. Explore Profitability Across Reporting Companies
Individual-company analysis is only one part of financial research. Investors may also be interested in broader profitability patterns among reporting companies.
The analyzer includes Profitability & Market Breadth Intelligence, using preprepared annual datasets from supported SEC financial observations.
Depending on available snapshots, users can explore:
- Numbers of included profitable companies
- Numbers of included loss-making companies
- Companies reporting zero net income
- Profitability and loss-making percentages
- Compatible aggregate profits and losses
- Median and quartile distributions
- Largest included profits and losses
- Historical profitability trends
- Transitions from profit to loss and loss to profit
- Multi-year profitability and loss streaks
These figures provide research context about the companies included in the available observations.
They are not a complete census of every SEC registrant or every publicly traded company. Coverage depends on the supported accounting concepts, reporting periods, currencies, quality checks, and administrator-prepared datasets.
15. Examine the Original Filing Behind Financial Figures
One of the most important advantages of filing-based financial research is the ability to trace information back to its supporting document.
Automated financial summaries can sometimes conceal differences in reporting periods, accounting definitions, or company-specific disclosures.
The SEC EDGAR Financial Analyzer emphasizes verifiable research by preserving supporting information such as:
- Reporting periods
- Filing dates
- Accounting concepts
- Reported units
- Source filing references
- Document and exhibit links
- Calculation definitions
- Data-availability and comparability limitations
Its historical research tools can also help users investigate whether values for a reporting period appeared differently in later filings.
A changed subsequently filed value is not automatically classified as a formal restatement. The underlying evidence and reporting circumstances must be examined.
For serious investors, this distinction matters. A useful research platform should not simply produce financial numbers; it should make those numbers understandable and verifiable.
16. Use the Financial Research Data with AI
Investors increasingly use artificial intelligence tools to help interpret financial information, organize research questions, and review large quantities of text.
However, AI can make mistakes when asked to reconstruct financial facts, invent unavailable assumptions, or interpret figures without sufficient context.
The SEC EDGAR Financial Analyzer provides a Use with AI feature designed to make this workflow more structured.
Users can select a research task and download available financial information and supporting evidence as a text or JSON research file.
The downloaded material can then be uploaded to a compatible external AI application for further analysis.
Depending on the selected research task and available data, the export can contain financial measures, historical statistics, calculation definitions, filing references, and relevant research instructions.
This approach is useful for activities such as:
- Organizing an investment research report
- Examining financial strengths and weaknesses
- Comparing historical performance
- Identifying financial questions requiring investigation
- Reviewing accounting relationships
- Preparing questions for further reading of company disclosures
AI-generated interpretations should still be verified against the supporting financial information. The downloaded research file is not a guarantee that an external AI system will interpret every accounting issue correctly.
17. Suitable for Beginners and Experienced Financial Researchers
Financial reports can be intimidating for investors unfamiliar with accounting terminology.
Terms such as EBITDA, return on invested capital, working capital, cash conversion, dilution, and non-GAAP reconciliation can appear frequently in investment discussions.
To make financial research more accessible, the analyzer includes a searchable Quick Jargon Guide explaining many common financial and filing terms.
It also provides a Beginner Research Compass that helps users explore fundamental questions about growth, profitability, cash generation, liquidity, leverage, returns, dilution, and capital intensity.
Experienced users can move directly into the more detailed research workspaces.
The objective is to support financial understanding without oversimplifying important accounting distinctions.
18. A Practical Investment Research Workflow
Investors do not need to examine every available metric immediately. A structured approach can make company research more manageable.
Step 1: Identify the correct company
Search by company name, ticker symbol, or Central Index Key (CIK). Verify that the filing entity is the company you intend to research, particularly when dealing with subsidiaries, funds, depositary securities, or similarly named companies.
Step 2: Examine business growth
Review revenue and earnings across multiple reporting periods. Investigate whether growth is consistent and whether profitability is developing alongside revenue.
Step 3: Compare earnings with cash generation
Examine net income, operating cash flow, capital expenditures, and free cash flow. Investigate significant differences rather than automatically treating them as favorable or unfavorable.
Step 4: Review financial strength
Examine debt, cash, liquidity, interest coverage, and other relevant financing relationships. Review the related filing notes for context.
Step 5: Investigate shareholders’ economics
Study earnings per share, diluted shares, share issuance, repurchases, and dividends where available. Consider whether changes in the share count affect per-share performance.
Step 6: Read the company’s risk disclosures
Review Risk Factors, MD&A, relevant financial statement notes, accounting policies, and significant recent filings.
Step 7: Compare with suitable peers
Where the data permits, examine comparable companies and industry context. Differences in business models and accounting presentation should be considered before making comparisons.
Step 8: Complete your own due diligence
Use the Investor Decision Desk checklist to record areas reviewed and matters requiring further attention. Download a research worksheet or supporting data if needed.
Finally, remember that understanding a company and determining whether its shares are attractively priced are separate questions. Share-price valuation may require reliable market quotations and additional inputs that are not supplied by this filing-based analyzer.
19. Who Can Benefit from the SEC EDGAR Financial Analyzer?
Long-term investors
Study financial consistency, cash generation, business durability, capital allocation, and disclosed risks over multiple reporting periods.
Value investors
Examine profitability, balance-sheet strength, cash-flow relationships, dilution, and company disclosures as part of fundamental due diligence.
Growth investors
Investigate revenue expansion, operating margins, business segments, capital requirements, and whether reported growth is translating into earnings and cash generation.
Dividend investors
Research dividend history, available cash-flow coverage, capital expenditures, debt obligations, and shareholder distributions.
Financial analysts and researchers
Use historical financial series, filing evidence, accounting calculations, company comparisons, and downloadable research data to support deeper investigation.
Accounting and auditing students
Apply accounting concepts to real company filings, examine the relationships between financial statements, and develop practical financial analysis skills.
International investors researching U.S. securities
Investors outside the United States, including those in Malaysia, can use publicly available SEC filings to research U.S. companies and certain foreign issuers reporting to the SEC.
Availability and reporting requirements differ by issuer, however, and the analyzer is not a substitute for the relevant home-market disclosures where those are important.
20. What Makes This Free Financial Research Tool Different?
Many financial websites concentrate on share-price movements, technical indicators, investment opinions, market sentiment, or analyst expectations.
The SEC EDGAR Financial Analyzer takes a different approach.
It concentrates on what companies have actually filed, what their financial statements report, how those figures relate to each other, and what the supporting evidence can establish.
Its distinguishing features include:
- Filing-based financial research: Analysis centered on reported company information rather than speculative estimates.
- Comprehensive accounting analysis: Financial statements, ratios, historical trends, and defined calculations in one application.
- Investor-oriented organization: A consolidated Investor Decision Desk alongside specialist research workspaces.
- Interactive financial visualization: Charts with figure-level inspection for easier historical analysis.
- Disclosure research: Risk factors, management commentary, financial notes, and significant filing events.
- Corporate and ownership research: Relevant insider transactions, governance records, and corporate actions.
- Company comparison and discovery: Financial screens, peer analysis, and industry context.
- Source verification: Direct supporting filing and document references where available.
- Financial learning assistance: Plain-language explanations of important accounting terminology.
- AI-ready research exports: Download available evidence for additional review with an external AI application.
These capabilities are provided as a free online financial research resource through AuditingAccounting.com.
21. Important Limitations Investors Should Understand
No financial research application can eliminate investment uncertainty.
The SEC EDGAR Financial Analyzer is designed to support informed investigation, but users should understand several important boundaries:
- Historical information is not a forecast. Past revenue growth, profits, or cash generation do not guarantee future results.
- Not all company data is available. Reporting practices, filing types, accounting concepts, currencies, and industry structures can limit extraction and comparison.
- Missing information does not mean zero. An unavailable accounting measure should not be interpreted as a reported zero balance.
- Financial ratios require context. A ratio that is useful for a manufacturer may not be appropriate for a bank or insurer.
- Filings can contain errors or revisions. Investors should consider amendments, subsequent filings, and relevant accounting disclosures.
- SEC filings are not a live stock-price service. The analyzer does not supply live market quotations, analyst consensus forecasts, or independently calculated price targets.
- Research observations are not recommendations. The application does not determine whether a security should be bought, sold, or held.
Important findings should be reviewed in the original filing and considered alongside other relevant information, including current market conditions, investment objectives, and risk tolerance.
Frequently Asked Questions
Is the SEC EDGAR Financial Analyzer free?
Yes. AuditingAccounting.com provides the SEC EDGAR Financial Analyzer as a free online research application for examining supported public-company filing information, financial statements, ratios, and related evidence.
Can I use the analyzer to research U.S. stocks?
Yes. You can search supported reporting companies by name, ticker, or CIK and investigate available financial information and SEC filings. Some foreign issuers also report through the SEC, although their reporting formats can differ.
Does the analyzer tell me which stock to buy?
No. The application provides financial information, accounting calculations, research statistics, and supporting evidence. It does not issue buy, sell, or hold recommendations.
Can I compare several years of company financial results?
Yes. Historical financial analysis is a major feature of the application. The Investor Decision Desk displays up to five compatible annual periods, while other historical workspaces may provide additional available series.
Does the application analyze company profitability and cash flow?
Yes. Depending on the company’s reported information, you can examine revenue, operating income, net income, margins, operating cash flow, free cash flow, and related financial measures.
Can I research insider buying and selling?
The analyzer includes ownership and insider-transaction research capabilities using supported filing evidence. Reported transactions should be interpreted in context because not every insider acquisition or disposition represents an ordinary open-market purchase or sale.
Can I use the analyzer with ChatGPT or another AI tool?
Yes. The application offers downloadable research files that can be uploaded to compatible external AI tools. The availability and quality of subsequent AI analysis depend on the selected tool and the evidence supplied.
Does the analyzer include real-time stock prices?
No. Its primary purpose is filing-based accounting and financial research. Real-time security prices, analyst targets, and market-derived valuation measures are outside its core data coverage.
What if a company does not report a particular financial metric?
The analyzer may display that measure as unavailable if sufficient compatible evidence cannot be established. It is designed not to replace missing reported figures with invented values.
Start Researching U.S. Companies for Free
Successful investment research requires more than following headlines, stock-price movements, or social media opinions.
It requires understanding the business, studying financial performance, evaluating cash generation, examining financial obligations, investigating shareholder economics, and reading the disclosures that explain important risks and developments.
The SEC EDGAR Financial Analyzer brings many of these research activities together in one accessible application.
Whether you are examining an established company, investigating a growing business, comparing industry peers, or studying a company’s changing financial condition, the tool can help you ask more informed questions and examine the supporting evidence.
Research the numbers. Understand the financial relationships. Examine the disclosures. Verify the source evidence.
Use the Free SEC EDGAR Financial Analyzer at AuditingAccounting.com
Disclaimer: This application and article are provided for financial research, accounting education, and general informational purposes. They do not constitute personalized investment advice, an investment recommendation, an audit opinion, or a guarantee of future performance. Investors should independently verify important information and seek appropriately qualified professional advice where necessary.